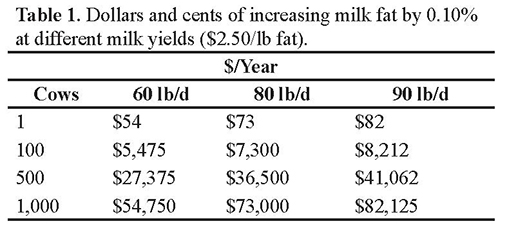
In today’s dairy markets, milk fat is a primary contributor to the value of milk and is also the most variable component. From an economic standpoint, increasing milk fat by a tenth of a percent can translate to greater income for a dairy operation (Table 1 below). A minor jump from 3.7% to 3.8% milk fat at 80 lb/d production level can bring in an additional $7,300 a year of income for a 100 cow herd.
Recently, researchers at Miner Institute and Cornell University have identified a connection between specific fatty acid groups and bulk tank milk fat and protein content, as well as how to measure these fatty acids in a rapid way using mid-infrared spectroscopy (MIR; Woolpert et al., 2016). In the mammary gland, fatty acids can be divided into three categories, de novo, mixed, and preformed.
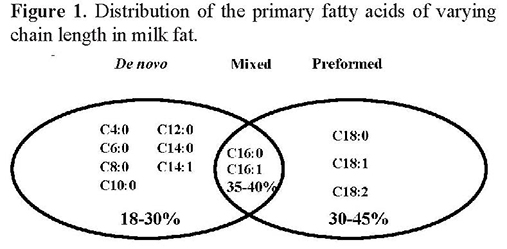
Figure 1, below, illustrates the distribution of fatty acids in milk fat and their origin:
– De novo fatty acids
Assembled in the mammary gland from acetate and butyrate
Consist of fatty acids varying in length from 4 to 14 carbons, and about half of the 16 carbon fatty acids
– Mixed fatty acids
Can be from either de novo or preformed origin
16 carbons in length
– Preformed fatty acids
These fatty acids are taken up from the peripheral circulation. They can be diet-derived or from the mobilization of body stores
These fatty acids mainly are long-chain fatty acids (i.e. 18 carbon length and greater)
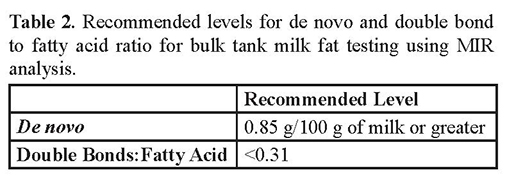
The MIR analysis can provide a rapid and cost-effective picture of the de novo, mixed, and preformed FA in milk. In addition, the average double bond to the fatty acid ratio can also be analyzed. This metric can be extremely useful in identifying cases of diet-induced milk fat depression. Table 2, below, details the recommendation levels of fatty acids for MIR analysis. Greater de novo fatty acids in the milk may indicate that the rumen is functioning properly, and are also correlated to greater milk fat and protein tests. However, it is important to remember that herds with greater de novo fatty acids are more likely to have:
More frequent feed delivery
More physically effective fiber (≥21%)
Greater bunk space/cow (≥18 in)
Lower stocking density (≤110%)
Best Practices for Fatty Acid Data
Use data as a herd “snapshot” and potentially for troubleshooting. Avoid using the data to make drastic dietary changes without considering other contributing factors.
Evaluate changes over time to determine what differences in fatty acids really mean and how far they deviate from baseline values.
Consider test data variations with changes of season and lactation (i.e. milk fat is higher in the winter months, and early lactation cows usually have greater preformed fatty acids)
Evaluate management and other on-farm factors that may influence milk fat
Determine what dietary factors may be influencing bulk tank numbers
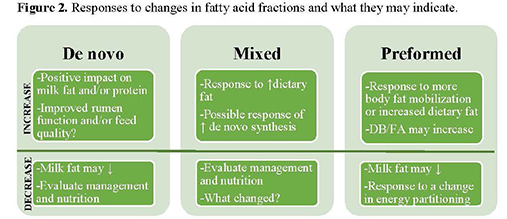
Figure 2, below, outlines what changes in milk fatty acids may mean
Analyzing bulk tank milk samples for fatty acids using MIR analysis can shed some light on the overall fatty acid distribution in your herd. However, once you identify that there may be some room for improvement it can be difficult to know where to start. Some strategies to improve farm profitability through enhancing components such as milk fat are detailed below:
Feed high-quality forage. The inclusion of high quality forages into dairy diets is a way to maximize home-grown ingredients and reduce purchased feed costs. Higher forage diets can aid in de novo milk fatty acid production and help promote a healthy rumen environment. Treating forages with Silo-King® maximizes quality and can aid in supporting ideal butterfat numbers. Silo-King® treated forages improve the digestion of fiber, as well as dry matter retention.
Focus on cow comfort and management. Overcrowding can greatly reduce production as well as component yields. Heat stress can be a major contributor to milk fat as well as milk protein decline. Keep an eye on rumination, DMI, and any evidence of panting. On average, milk fat percentage may be expected to drop 0.20% over the summer months.
Minimize dietary contributors. Research has shown that increasing dietary fiber while still maintaining high unsaturated fatty acid levels resulted in increased CLA production – a characteristic sign of milk fat depression risk (Rico et al., 2015). Therefore, reducing high levels of unsaturated fatty acids is key even if fiber is adequate. Other factors that should be considered are ration particle size, mold and/or yeast loads, and dietary starch level.
Reduce counter-productive ingredients. These ingredients are added to reduce the effects of another ingredient. For example, increasing the level of palmitic acid to bolster milk fat during milk fat depression caused by excessive high-oil ingredients. The best strategy is to reduce diet unsaturated fatty acid levels. Another example is providing excess levels of buffer to counter high starch levels and low effective fiber. Focus on keeping starch between 23-28%, and NDF-Forage at 20-23%. These conditions can maintain production as well as keep the rumen functioning properly.
Recovery of milk fat takes time. Recovery of milk fat to normal levels after a bout of milk fat depression can take two weeks or longer. Depending on the nature of the change, milk fatty acids can be expected to recover quickly in response to fat supplementation, but changes in rumen fermentation to alleviate true diet-induced milk fat depression can take 10-14 days (Rico and Harvatine, 2013).
Conclusion
Maintaining or increasing milk fat is a way to increase farm profitability and herd health, but can be challenging. Even apparently logical ration changes can result in a decline in milk fat. Bulk tank testing data, as well as additional on-farm metrics, provides a farm with an idea of how farm management practices and changes in feed can influence revenue from milk and identify and changes that need to be implemented to improve the herd. Herds that have the ability to monitor bulk tank fatty acid data on each shipment or test day may benefit the most from this analysis. Focusing on ways to improve overall dairy herd health and management help to bolster milk yields and components in the long run. AK